
Today I’m sharing nine fun facts about the economy, markets, and retirement.
Along with being entertaining, these facts bring important planning topics to the surface.
They also help to address and answer common questions.
For example:
- How correlated is the economy to the stock market?
- What are the actual odds of a catastrophic long-term care event?
- Should average life expectancy assumptions be used in retirement projections?
If you’re ready to have some fun learning about the history of the markets and little-known facts about investing, this episode is for you.
Need Tax + Retirement Planning Help?
We specialize in helping people aged 50+ lower taxes, invest smarter, and (safely) create a retirement paycheck.
Our Free Retirement Assessment™ will answer your BIG questions and help you properly evaluate our firm.
Click the banner below to learn more. 👇

Listen To This Episode On:
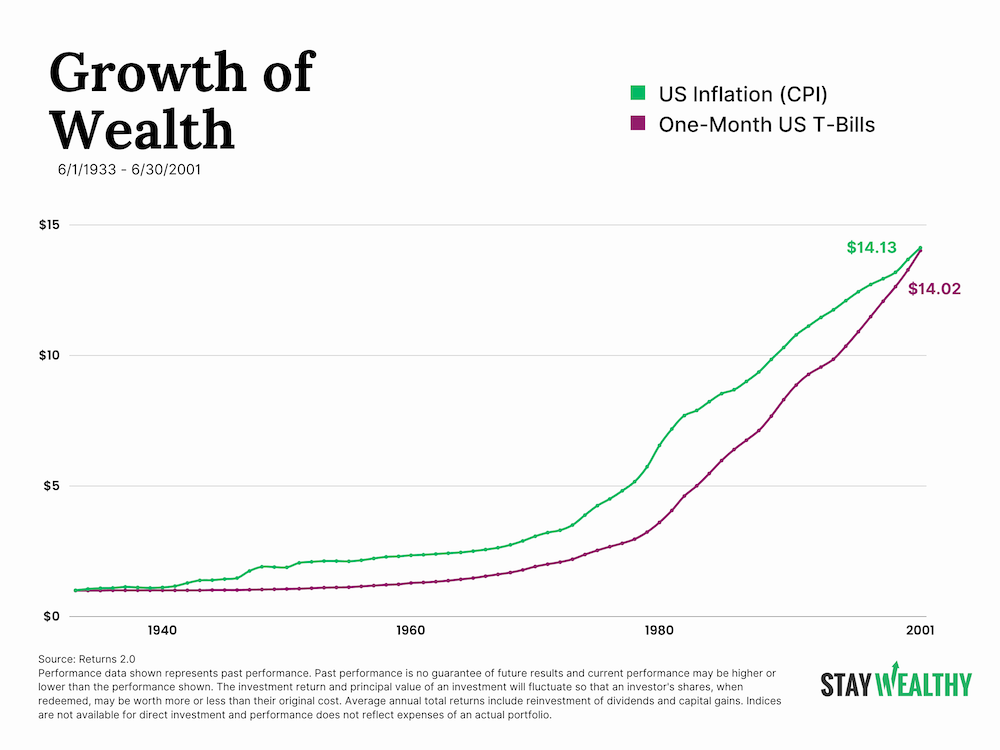
Cash vs. Inflation (68 Years)
When You’re Ready, Here Are 3 Ways I Can Help You:
- Get Your FREE Retirement & Tax Analysis. Learn how to improve retirement success + lower taxes.
- Listen to the Stay Wealthy Retirement Show. An Apple Top 50 investing podcast.
- Check Out the Retirement Podcast Network. A safe place to get accurate information.
+ Episode Resources
📬 Want more retirement and investing content? Join thousands of listeners and subscribe to the Stay Wealthy Retirement Newsletter!
Resources Mentioned:
- 11 Surprising Facts About Tax Planning, Investing, and Retirement
- The Magnificent 7 Stocks
- S&P 500 Components
- The Real Interest Rate of One-Year Bonds
- Peter Lynch:
- Life Expectancy:
- Long-Term Care: 13% of People Over Age 65 Will Spend $150k+
- Most of Warren Buffet’s Wealth Created After Age 50
- Mark Cuban Hasn’t Profited From Shark Tank
- 101 Years On Wall Street (John Dennis Brown)
- The Stock Market is Not the Economy
- Monroe and the Quincy Coca-Cola Millionaires
+ Episode Transcript
Taylor Schulte: Welcome to the Stay Wealthy podcast, I’m your host Taylor Schulte, and the world is feeling extra heavy at the moment. In addition to events overseas, I’ve had a few unfortunate events in my personal life that have just put me in a bit of a funk these last couple of weeks.
But, today, I want to lighten the mood and have a little fun. For myself and for anyone else who is feeling some extra heaviness right now. To do that, I’m sharing 9 surprising, little-known facts about the economy, markets, and retirement planning.
Long-time listeners might remember that I published a similar episode a couple of years ago which I’ll link to in today’s show notes if you missed it or want to listen again. But there are two favorite stats from that episode I find myself continuing to revisit and share with people.
The first is from Morgan Housel, author of The Psychology of Money, and he shares that for the last 100 years, the U.S. stock market has declined at least 10% once every 11 months.
In other words, he emphasizes, if a so-called market expert appears on the news predicting an upcoming 10% decline in the stock market, they should really just say,
“Everything’s gonna be normal, and this upcoming correction I’m predicting happens on average every 11 months.”
My second favorite stat from that episode was from the legendary Peter Lynch, manager of Fidelity’s Magellan Fund which averaged a 29.2% annual return during his 13-year tenure, double that of the S&P 500.
While that’s a crazy fact on it’s own, in one of Peter’s books, he shared that starting in 1965, if you invested the same dollar amount at the peak of the U.S. stock market every single year until 1995 (a 30-year time period) your average annual rate of return would have been 10.6%.
However, if you timed the market perfectly, and instead invested that same amount of money at the low point of each year for those 30 years, your average annual return would have been 11.7%. And if you kept things really simple and just invested on the first day of each year for those 30 years, your return would have been 11%.
In other words, the difference between perfect timing and lousy timing was only 1.1%. As Peter put it,
“People spend an unbelievable amount of mental energy trying to pick what the market’s going to do, what time of the year to buy it. It’s just not worth it.”
As I and many others have shared before, time in the market means more than timing the market, and with the current state of the markets and economic landscape, I think Peter’s stat is a particularly good one to hang onto right now. While many of our listeners are close to retirement or in retirement, this adage of time in the market still applies. A long-term investment plan that spans multiple decades is still required to maintain purchasing power and create sustainable income.
Ok, let’s jump into today’s 9 fun facts. To grab the links and resources backing up the statistics from today’s episode, just head over to youstaywealthy.com/202.
9 Fun (and Useful!) Facts About Investing & Retirement
While most of today’s facts and statistics are timeless, the first one to share with you today is specific to the current state of the markets here in 2023.
And that is that, year to date, through October 13th, 2023, the S&P 500 has had a positive total return of about 14%. Despite all the crazy headlines, inflation, 8% mortgage rates, overseas way, a looming recession, the U.S. stock market is up double-digits.
However, what isn’t so obvious is that the 7 largest stocks in the S&P 500 – sometimes referred to as the Magnificent 7 – are responsible for just about all of the gains we’ve seen this year. You can probably guess those 7 stocks…Apple, Microsoft, Amazon, Nvidia, Google, Facebook, and Tesla. These 7 magnificent stocks are up ~90% year-to-date. That’s nine, zero. 90%.
Meanwhile, the S&P 400 and S&P 600, two indexes that track mid and small companies and do not include those 7 companies have a 1.68% return and –2.45% return, respectively, so far this year.
In other words, while the U.S. stock market on the surface seems to be producing healthy returns in 2023, looking under the hood tells a different story. Most U.S. stocks are relatively flat or negative this year.
According to Liz Anne Sonders, the chief investment strategist at Charles Schwab,
“It’s typical that some of the larger-cap companies are going to drive performance in the U.S. But it becomes a bigger risk when there is dramatic underperformance by basically the rest of the index.”
The risk she is referring to is these 7 stocks coming back to reality and bringing the value of the entire S&P 500 index down with it.
The bigger risk I see is diversified investors getting lured out of their smart, diversified portfolios and chasing the returns of the U.S. stock market. It’s not easy to watch a single asset class produce double-digit returns, while your boring globally diversified portfolio of stocks and bonds lags behind, especially when that single asset class is the U.S. stock market.
Knowing that these double-digit returns are largely being driven by just 7 companies, hopefully, prevents investors from making emotional changes to their portfolio and chasing trends and provides a better perspective of the current state of the stock market.
The second interesting fact to share with you today is about investing in cash. More specifically, the risk of investing in cash. So get this, from June of 1933 to June of 2001, a 68-year time period, one-month Treasury bills (i.e., cash), produced negative real returns. For 68 years, cash produced a negative real return.
As a reminder, the real return of an investment is the rate of return after accounting for inflation. And real returns are important to monitor because the reason we invest our money in different asset classes is to preserve our purchasing power and outpace inflation for long periods of time.
But, during this 68-year time period, almost 7 decades, inflation outperformed cash. As Michael Batnick wisely put it,
“what’s safe in the short run can be risky in the long run.”
And this leads nicely to the third statistic to share with you which is timely given today’s environment. As most know, high-yield savings accounts and money market funds are paying between 4-5% at the moment. It’s all the rage right now – consumers are finally excited to be earning a meaningful return on their cash.
But what if I told that you today’s cash environment isn’t all that different than it was in 2019, before Covid, before trillions of dollars were injected into the economy, before a surge in inflation and a rapid spike in interest rates.
I believe I’ve shared it before but there’s a great website which I’ll link to in the show notes that produces dozens of real-time interactive historical charts, with one of them being the long-term REAL returns of 1-year treasury bonds.
So, today, a one-year treasury bond pays about 5.40%, a similar rate to money government money market funds investors are using right now to park their cash. As the chart illustrates, if we account for the current inflation rate of 3.7%, the REAL return on our safe 1-year treasury bond is 1.70%.
Rewind back to January of 2019, and 1-year treasury bonds were paying about 2.57%. Not too exciting. However, inflation was also not very exciting, comfortably sitting around 1.52%. After accounting for inflation, our real rate of return was just over 1% as of that January, not terribly different than today’s environment.
To be clear and to get ahead of emails correcting me, I realize that inflation didn’t sit at 1.52% for all of 2019. It crept up slightly, ending the year around 2.4%. But one-year bond yields also increased and still produced a total positive real return for the year.
To summarize, while we, of course, want to optimize our cash and ensure we’re getting the highest rate of return we can on our liquid savings, it’s important to factor inflation into our calculations and not be fooled into thinking that 5% today is wildly different than 2% a few years ago. In fact, many investors would likely prefer to rewind back to low nominal rates and low inflation.
Ok, switching gears for a moment. This next stat is about life expectancy, an important assumption to take into consideration when making most retirement planning decisions. In fact, at my firm, we use age 100 when running all of our retirement planning projections, and new clients will often push back, telling us there’s no way they will live to age 100 – that our assumption is not accurate.
We explain that we use age 100 to put extra pressure on the analysis to account for the unknowns in life, but also highlight that it’s not terribly far off for many of our clients. And that’s because, according to multiple studies, individuals in the U.S. who are more highly educated live longer lives, on average.
Naturally, higher education typically leads to higher-paying jobs which affords the opportunity to pay for better food, housing, medical care, and so on. So, while life expectancy for the average 65-year-old female today is about 82, you, like many of our clients, may not be average.
In fact, one study concluded that among women in the top tenth of earners, life expectancy rose by almost 7 years. Level of education, and higher than average income and net worth coupled with being an active, non-smoking married person with healthy eating habits and parents with good longevity, means that living well into your 90s is very possible.
While there’s no crystal ball and life has plenty of curveballs, my point in highlighting these statistics is that longevity risk is a real threat in retirement, and it doesn’t make its way into planning conversations as often as it should.
Speaking of risks and threats to our retirement, the 5th stat to share is about long-term care. Most retirement savers, at some point, have been told that 70% of people turning 65 today will need some form of long-term care services in their lifetime. And about 25% of those people will need that care for two years or more.
However, what often isn’t shared is that only about 13% of people who are age 65 today will spend over $150,000 in lifetime, out-of-pocket long-term care expenses. Even crazier, roughly 63% of people age 65 today will have zero out-of-pocket long-term care expenses during their lifetime. The other 24% will fall somewhere in between.
And I share all this to point out that when you pull back the curtain, a relatively small percentage of the population is truly at risk for an extreme catastrophic long-term care event. Now, that doesn’t mean you should roll the dice and assume that because you’re in good health you should ignore this part of your retirement plan. Quite the opposite.
Everyone needs to have a plan for a potential long-term care event. But not everyone needs to be spooked into buying long-term care insurance to protect against a catastrophic, retirement plan destroying event.
Ok, stat number six. Warren Buffett, chairman and CEO of Berkshire Hathaway, often referred to as one of the greatest investors of all time and Berkshire as one of the top-performing investments of all time. In the 20 months leading up to the dot-com peak in the 90’s, Berkshire Hathaway lost 45% of its value.
The NASDAQ, during those same 20 months, gained 225% over the same time. Investing is hard. It requires conviction, patience, and discipline. Imagine watching your portfolio get cut in half while the rest of America is getting rich buying internet stocks on Etrade. But that discipline, the discipline to stay the course during a time period of significant underperformance, is why Warren Buffett has been one of the most successful investors in the world.
Another fun fact while we’re talking about Warren, 99% of his wealth was created after his 50th birthday. As the famous quote goes, it takes decades to become an overnight success.
Speaking of overnight successes, Shark Tank, one of my favorite shows, just kicked off its 15th season and inspired this 7th statistic. As most know, billionaire Mark Cuban is one of the regular sharks on the show. He’s also arguably the most famous shark and, as a result, he’s invested $20 million dollars in shark tank deals since the show began – more than any other shark.
But just because he’s successful, famous, rich, and has access to pretty much any investment deal he wants, doesn’t mean he’s mean he is able to capture higher investment returns than you or me. In fact, last year, he publicly shared that he hasn’t made a profit from his suite of shark tank investments, that he’s taken a net loss so far on all the investments combined.
While there are still potential exits in some of his existing shark tank deals that could come to fruition in the future, Cuban’s public remarks reinforce something I’ve shared dozens of times. And that is that successful investing doesn’t require early access to exciting start-ups or access to exotic investment managers or hedge funds offered to the ultra-wealthy.
For the last 15 years, a boring low-cost index fund investor, outperformed one of the most famous investors on Shark Tank.
Now, some start-up investments do hit big, making up for all the other failed investments, which brings us to stat number eight. And this stat is about a company that we’re all very familiar with, and that is Coca Cola. The Coca Cola Company, as it’s formally referred to, went public in 1919, and was very much a start up at the time.
If an investor had purchased one $40 share of Coca Cola when it made it’s debut, and reinvested all of the dividends along the way, today, that $40 investment would be worth over $10million. Similar to my comments about Warren Buffet, holding this stock through all the ups and downs would have been no easy feat.
In fact, the stock experienced multiple drawdowns over 50% along the way and several drawdowns over 20%. Like all investments, the performance was far from being a straight line up and to the right. It has been a rocky, challenging 103 years.
One of the most famous early 20th-century Coca Cola investors was a guy named Mark Monroe, and his conviction in the start-up is said to be responsible for 67 what they call “Coca millionaires” in the little town of Quincy, Florida where Monroe worked as a banker. And it’s been reported that many of the descendants of these early Quincy investors still hold onto these original shares today.
Lastly, our ninth and final stat. In John Dennis Brown’s book, 101 Years on Wall Street, he shares that in 1908, the earnings (or profits) of all the companies in the Dow Jones Industrial Average were cut in half. However, the index that year returned a positive 46%.
In other words, the stock market is not the economy. In fact, according to a study done by the London Business School, there’s only a slight positive correlation between GDP growth and stock market performance. We’ve seen similar developments play out over the years between the stock market and the economy that aren’t isolated to GDP or company earnings.
For example, in 1982, unemployment entered the year at 8.6% and finished close to 11%, its steepest level since the Great Depression. However, the S&P 500 returned 21.6% that year, double the long-term historical average.
As one Morningstar article puts it,
“stocks anticipate future developments rather than dwell on current affairs.”
Ok, that wraps up today’s episode. I hope you enjoyed listening as much as I enjoyed taking my mind off things, doing the research, and putting it all together.
Once again, to grab the links and resources the support the stats shared with you today, just head over to youstaywealthy.com/202.
Thank you as always for listening, and I will see you back here next week.
Disclaimer
This podcast is for informational and entertainment purposes only and should not be relied upon as a basis for investment decisions. This podcast is not engaged in rendering legal, financial, or other professional services.


